GNSS reference station plots

The map displays the quality status of the GNSS signals recorded by the reference stations with a 1-2 minute delay. Green indicates that the quality of the GNSS signals recorded by the reference station is good. Yellow indicates weak and stronger signal interference. GNSS interference problems can be caused by intentional interference, unintentional interference or weather conditions. If the color is black, there is no connection to the real-time data stream of the GNSS reference station. This can be due to equipment malfunctions, server operation, power or internet outages, etc.
Selecting a GNSS reference station from the map or "Reference Stations" drop-down menu opens the reference station quality graphs. Reference stations marked with a blue circle on the map provide meteorological data, and the graphs open in the reference station view. These graphs are interactive and the information on the graphs is in local time.
- Green - everything is fine
- Yellow - weak signal interference
- Red - signal interference
- Black - no information
- Station with Meteo data
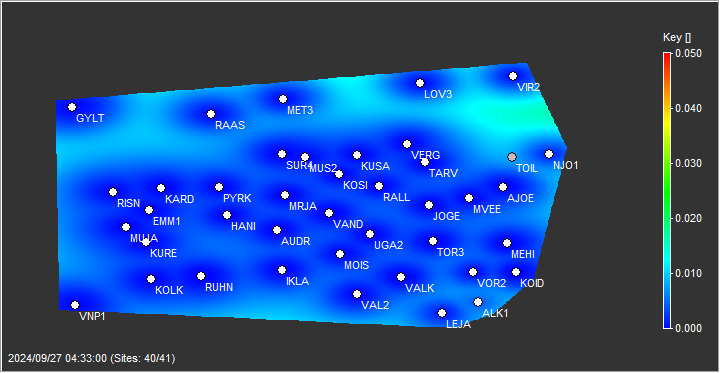
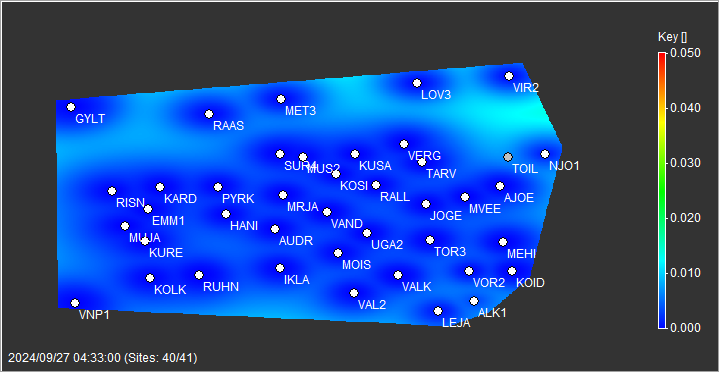
A general indicator of the residual error (RMS) for the whole network

Ionosphere
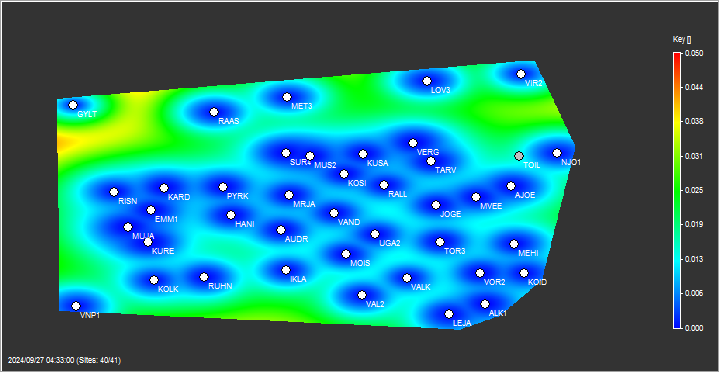
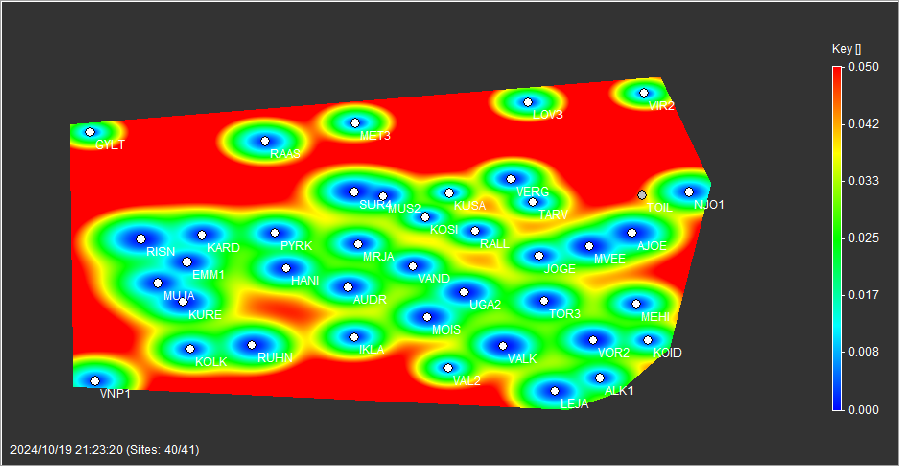
Troposhpere